Order flow, footprint and volume
The heart of ATAS — and of our trading. Here you see what's actually executing: buy aggression against sell aggression, absorption and the footprints of institutional money.
What order flow is
Every market buy or sell leaves a trail. Order flow reads it tick by tick: how much volume hits each price and on which side. Instead of guessing direction, you see it.
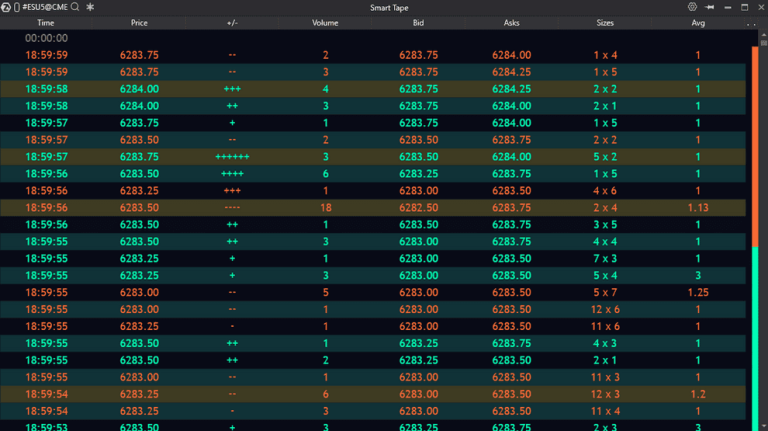
Smart Tape
ATAS's time & sales tape, filtered and colored so what matters stands out: large blocks, aggressive executions and imbalances. You catch institutional activity as it happens, without drowning in noise.
Footprint and delta
The footprint opens up each candle and shows the volume traded on the buy and sell side at every price; delta sums up that imbalance. Together they reveal where there's accumulation, where absorption, and where price is likely to turn. To know which prices to watch for these signals, combine it with volume profiles and levels.
Cluster Search: hunting explosive volume
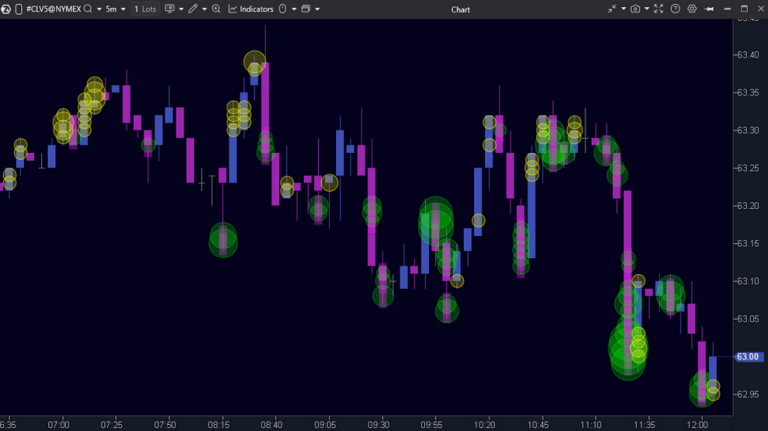
Cluster searches pinpoint the candles where volume explodes at a single price — the exact moment large hands step in. It's the very pattern that triggers Magic Cluster Suite's signals.
Stacked imbalances
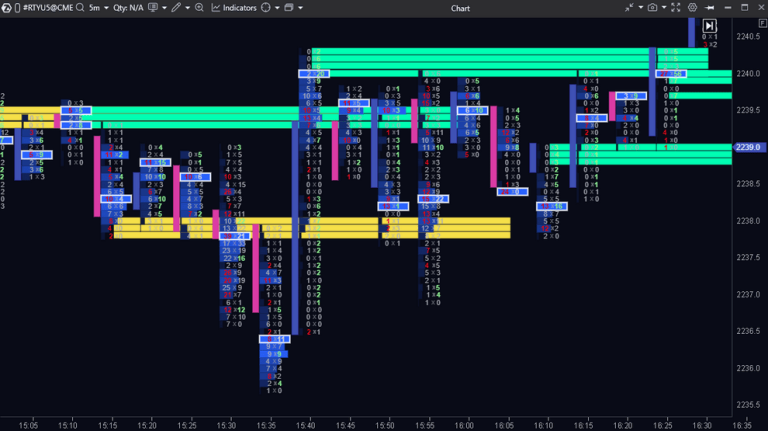
When several candles in a row show strong imbalances on the same side, the market leaves an unmistakable trail: someone is pushing hard. Stacked imbalances flag momentum breakouts that are hard to ignore.
Our professional layer: Magic Cluster Suite
On this same flow, Magic Cluster Suite automatically detects high-probability zones: it flags when volume and delta exceed their session average, so you don't have to watch the tape tick by tick. Built for ATAS X (Mac); available on Mac as soon as ATAS enables synchronization.
See Magic Cluster Suite